Youngstown Ohio 2025 Housing Forecast
2025 trends in affordability, home values, rents, investor ROI, and DSCR context for Youngstown and the broader metro area.
Youngstown remains one of the most affordable housing markets in the United States—an important reality for households and a key reason investors keep it on their radar. This 2025 forecast focuses on the Youngstown housing market and the Youngstown–Warren–Boardman metropolitan area, using widely referenced public datasets and investor-style underwriting logic to explain affordability, rent performance, and potential return profiles compared to Ohio and the U.S.
Data sources and assumptions are explained near the end of this article.
Table of Contents
- Youngstown 2025 market snapshot
- Why Youngstown stays affordable
- Home value trend and what it implies
- Rent trends and what drives demand
- ROI math: yields, value-add, and scaling potential
- DSCR explained + comparative context (Youngstown vs Ohio vs U.S.)
- Risks to watch in 2025
- Practical investor takeaways
- Sources and disclosures
Youngstown 2025 Market Snapshot
A quick comparison: prices vs. rents
Youngstown’s defining feature is low home prices relative to rents, especially when compared to many U.S. cities where prices surged faster than incomes and rents. That relationship shapes everything: affordability for residents, and “cash-flow math” for investors.
- Youngstown (city) is often far below state and national price levels.
- The Youngstown–Warren–Boardman metro is typically higher than city-only figures but still below Ohio and the U.S.
- Ohio remains more affordable than the U.S. overall, yet Youngstown often remains more affordable than Ohio.
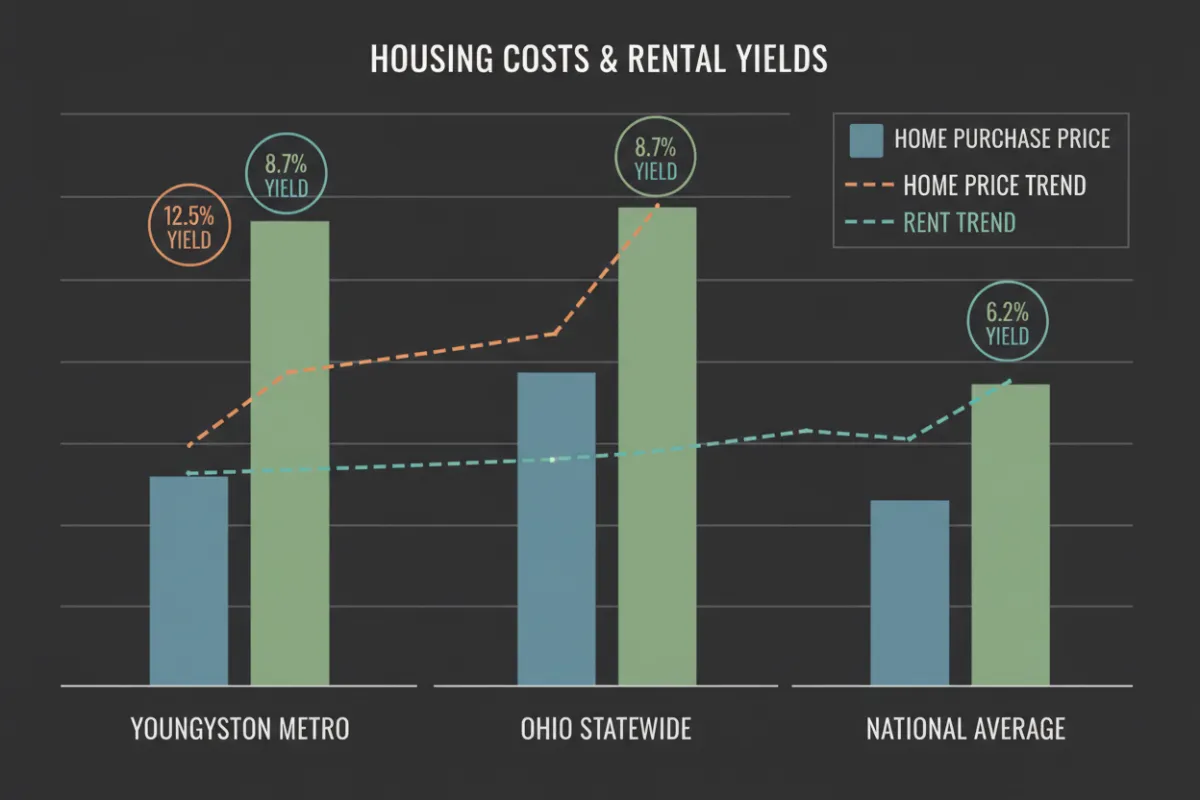
Lower purchase prices paired with resilient rents can create higher rent yields—if vacancy and expenses remain controlled.
Why Youngstown Remains One of the Most Affordable Housing Markets
Youngstown’s affordability is often explained by structural factors that don’t change overnight:
- 1) Prices tend to track local income more closely
In many high-growth metros, prices disconnected from local incomes due to migration and constrained supply. In markets like Youngstown, pricing tends to stay closer to local earning power and long-run demand. - 2) Older housing stock keeps entry prices lower (with tradeoffs)
Older inventory frequently means lower acquisition costs, more variability in condition, and higher importance of inspections, rehab planning, and reserves. - 3) Market behavior is often fundamentals-driven
Some markets are dominated by “fear of missing out” cycles. Youngstown tends to reward investors who focus on fundamentals: rent realism, tenant demand, and building quality.
Important
Affordability alone doesn’t guarantee a good investment. The deal still needs to work after expenses, vacancy, and long-term maintenance.
Home Value Trend: What the Metro Index Suggests
What this can mean in 2025
To understand longer-run direction, analysts often use repeat-sales style price indices at the metro level. The Youngstown metro index shows a clear upward trend from 2020 into 2025, though not in a perfectly straight line.
- If borrowing costs decline, affordability improves and demand can lift
- If rates remain higher, rental demand may stay elevated (supporting rents)
- Value-add renovations can outperform the broader index when executed well
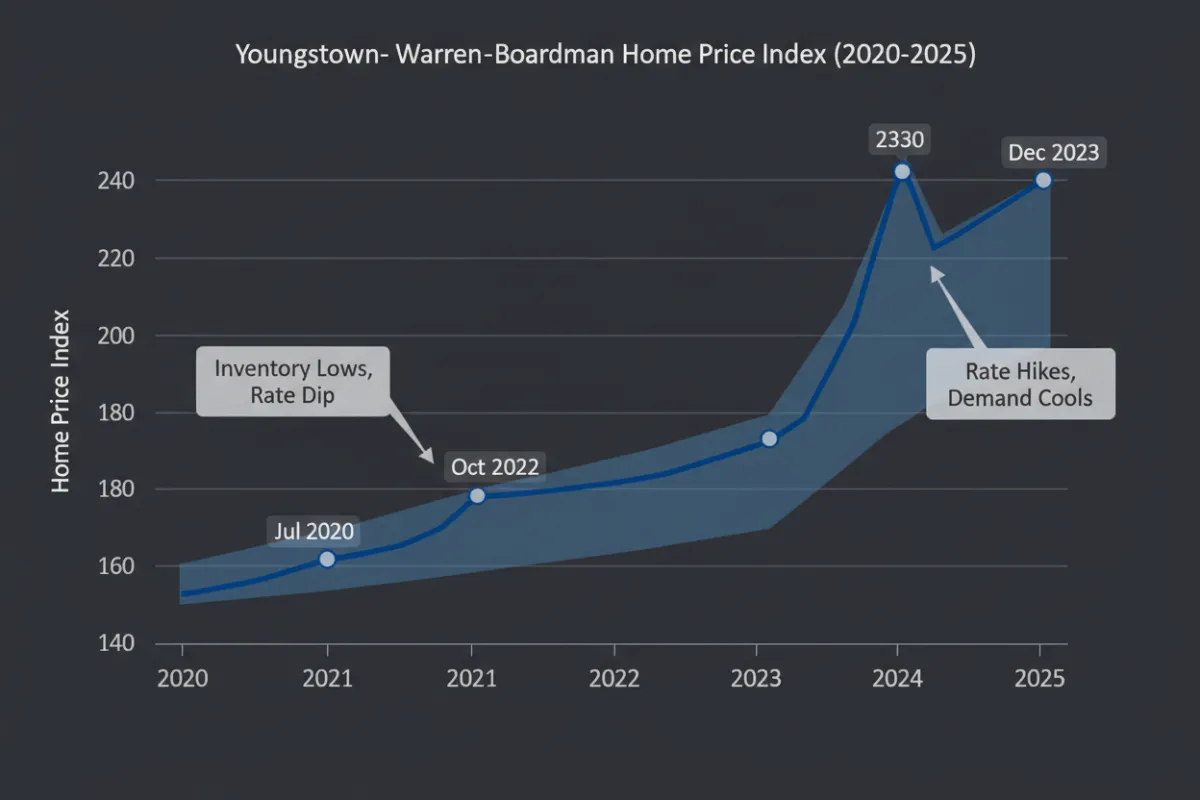
Index trends are useful for directional context and are best interpreted alongside inventory, rates, and rental demand.
Rents in Youngstown: The “Engine” Behind Investor Interest
For investors, rent performance matters because it supports carrying costs and determines yield. Youngstown’s appeal is that rents don’t have to be exceptionally high to support healthy yield—because the entry price is often low.
What can support rent stability
- Demand for affordable rentals as ownership costs rise
- Household formation and renter preference in certain submarkets
- Limited quality rental supply in some neighborhoods
What to underwrite carefully
- Vacancy (assume it exists even in “hot” pockets)
- Maintenance and capex (older homes require reserves)
- Property taxes and insurance (can vary significantly)
- Management costs (even if self-managing, assign a cost)
ROI in Youngstown: Where Returns Commonly Come From
Investors tend to approach Youngstown in three common ways:
- Strategy A — Buy-and-hold cash flow
Lower prices can translate into stronger gross rent yields than many U.S. metros. - Strategy B — Value-add rehab (buy + improve + rent)
Older inventory can enable forced appreciation—if the renovation plan matches tenant demand and rent ceilings. - Strategy C — Scaling unit count
Because entry costs are lower, some investors scale portfolio size faster—assuming operations (maintenance + management) are reliable.
Gross Rent Yield + DSCR Context — Youngstown Metro vs Ohio vs U.S.

Yield and DSCR are sensitive to expenses, financing terms, and rent realism. Treat comparisons as directional context, not guarantees.
DSCR Explained (and Why It Matters for Investors)
DSCR (Debt Service Coverage Ratio) is a property cash-flow metric commonly used by lenders and investors:
DSCR ≥ 1.00 means NOI covers the debt payment in that model. Lower DSCR means the property may not support the payment without additional cash input.
Why lower-priced markets can show stronger DSCR math
When home prices are lower relative to rent, a mortgage payment may be more manageable relative to NOI—especially at moderate leverage.
Risks and Constraints Investors Should Watch
Key risks to consider:
- Condition risk: older homes can hide major repairs
- Neighborhood variance: outcomes can differ dramatically by block
- Insurance and tax volatility
- Tenant screening and management execution
- Rate volatility affecting refinance strategy
Practical risk reduction checklist
- Inspection + scope-of-work before close
- Budget capex reserves (roof, HVAC, plumbing)
- Underwrite vacancy and repairs conservatively
- Use neighborhood-level comps and rent evidence
Why Youngstown Often Ranks Well for Cash-Flow-Focused Investors
Many U.S. markets shifted into low-yield territory after prices rose faster than rents. In contrast, Youngstown’s affordability can preserve rent yields and DSCR math—especially for investors who buy clean assets in stable pockets and manage well.
Get the Free Youngstown Investor Toolkit
Download a simple toolkit: rent assumptions checklist, rehab budgeting worksheet, and a deal underwriting template.
No spam. Unsubscribe anytime.
Form collects name and email for toolkit delivery and optional future updates about the Youngstown market.
FAQ
Is Youngstown a good market for beginners?
It can be, but it requires disciplined underwriting and strong property management—especially due to condition variance and neighborhood differences.
Are rents likely to keep rising in 2025?
Rent direction depends on submarket demand and supply, plus broader economic conditions. Underwrite conservatively.
What’s the biggest risk in this market?
Operational execution: property condition, tenant selection, and maintenance reserves.
Sources, Assumptions, and Disclosures
This article references publicly available housing datasets (home value and rent indices, plus metro-level price indices) and uses general investor underwriting logic for yield and DSCR context.
Disclosure: This content is for informational purposes only and does not constitute investment, tax, or legal advice. Past performance is not indicative of future results. Market conditions can change rapidly.
Detailed data sources, indices, and exact assumptions used in charts are listed here for transparency.